Resource Scheduling

After the objective of a project has been explicitly specified, one of the important constraints to be considered is the means or resource by which it is to be attained. A resource is a physical variable, such as labour, finance, equipment and space, which will impose a limitation on time for the project. When the resources are limited and conflicting demands are made for the same type of resource, a systematic method for the allocation of resources becomes essential. Resource scheduling usually incurs a compromise and the choice of this compromise depends on the judgment of managers.
There are basically two approaches in solving such a problem, resource leveling and resource allocation. In resource leveling, the total project duration is maintained to the minimum level, but the activities having floats are shifted so that a uniform demand on the resources is achieved. In other words, the constraint in the case of resource leveling operation would be the project duration time. In resource allocation, the main constraint would be on the resources. If the maximum demand on any resource is not to exceed a certain limit, the activities will then have to be rescheduled so that the total demand on the resource at any time will be within the limit. The project duration time consequently is exceeded.

Complexity of Network Scheduling with Limited Resources
Problems of resource scheduling vary in kind and severity, depending upon the project and the organizational setting. The problem of scheduling activities so that none of the resource availabilities are exceeded and none of the precedence relationships are violated is an exceedingly difficult task. Scheduling projects with limited resources is a large combinatorial problem. That is, there are a very large number of combinations of activity start times – each combination representing a different schedule - too large to enumerate even with a computer.
Heuristic Programs
In recent years a good deal of work has been done in the development of heuristic programs for solving large combinatorial problems. Heuristic programs for resource scheduling may take one of the following two forms:
i. Resource Leveling Programs. These attempt to reduce peak resource requirements and smooth out period-to-period assignments, within a constraint on project duration.
ii. Resource Allocation Programs: These allocate available resources to project activities in an attempt to find the shortest project schedule consistent with fixed resource limits.

Cost Calculation for Project management


Time-Cost Trade-off Relationship for a Typical Job

The Cost Consideration


The CPM was developed to solve the scheduling problems in an industrial setting. It was more concerned with the costs of scheduling and how to minimize them. Most jobs can be reduced in duration if extra resources are assigned to them. If the other advantages outweigh the additional cost, then the job should be expedited or crashed. But it is not necessary to crash all jobs to get a project done faster; only the critical jobs need be expedited. The CPM attempts to solve the problems of finding such jobs and how to crash them.


Schedule-Related Project Costs


The cost of a project is due to the direct costs associated with individual activities and the indirect expenses such as managerial services, indirect supplies, equipment rentals etc. Normally the direct costs related to an activity will increase if we crash that activity. On the other hand, the indirect costs decrease if the activity is shortened.

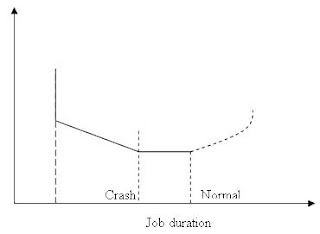
The relationship can be expressed by a straight line on a graph plotting job duration versus cost. The steeper the slope of this line, the higher the cost of expediting the activity. A horizontal line, then, indicates that crashing the job would result in no decreased efficiency shortening is possible (either because the job duration cannot be reduced further or because some other job has become critical on a parallel path). If there are parallel critical paths, then one job in each of them must be chosen for crashing. The improvements are made in a stepwise fashion and the new schedules are continued as long as the jobs can be crashed with a net reduction in total costs.


Basic Concepts of Network Cost Systems


The basic concept of PERT and CPM cost systems is different from that of most cost accounting systems. In essence it is: Costs are to be measured and controlled primarily on a project basis rather than according to the functional organization of a firm. The rationale of the system is the entirely logical notion that responsibility for expenditures should coincide with responsibility for managing that which gives rise to the expenditures. Under a PERT or CPM management system, project managers and submanagers are ordinarily chosen for supervising individual activities and they should be responsible for controllable costs associated with the activities.

A project-oriented cost accounting system does not necessarily replace existing systems based on organizational structure. If the costs are identified with the proper degree of detail, cost summaries can readily be generated on either basis.


Cost Accounting by Work Packages


If a project has been broken down into activities small enough to be used for purposes of detailed planning and scheduling, many such activities would be too small to be used and, therefore no added cost. If a job cannot be shortened regardless of extra resources applied to it, the line would be vertical. All the three possibilities are represented in figure 3.2.
There is probably a minimum duration which cannot be reduced no matter what the expenditure of resources (vertical portion of line). Similarly, slowing the job will decrease the costs only upto a certain point; beyond this no additional savings are obtained (horizontal portion of line).
The Lowest-Cost schedule
The CPM model specifies a method for finding the optimum point representing the lowest-cost schedule. A preliminary schedule is generated in which all jobs are assigned at their early start times and with normal resources. The length of this maximum duration schedule can be reduced only by expediting one or more of the critical path activities at an extra cost.

At each step of the process, the cost-time slope of each critical job is examined, and the job with least slope is determined. This job is expedited upto the point where no further conveniently for cost-control purposes. If so, several related activities may be grouped together into larger "work packages". These represent particular units of work for which responsibility can be clearly defined and which are still small enough to be manageable for planning and control purposes. The work packages formed at the lowest level of breakdown, then, constitute the basic unit in the PERT cost system by which actual costs are (1) collected and (2) compared with estimates for purposes of cost control.
Forecast of Project Costs
For planning and budgeting purposes, it is useful for a manager to know the time pattern of the expenditures. If costs are estimated for each work package then a projection of costs can easily be made. To do this, the assumption is usually made that expenditures for an activity are incurred at a constant rate over the duration of the activity. If this assumption is not valid for certain activities, they should be divided into a sequence of two or more activities, each having a constant expenditure rate.
A schedule graph, in which the network is plotted on a time scale and in which the horizontal length and placement of activity arrows indicate activity duration and schedule, facilitates cost calculation. When cumulative costs are plotted versus time, the graph illustrates the budget implications of early start and early finish times. The area between these two curves represents a range of budgets which are feasible from a technological viewpoint.
Analysis and Control of Project Costs
The first step in the control procedure is the measurement and recording of costs which are incurred as the project progresses. At the same time that costs are reported, an estimate should be made of the percentage of work accomplished. With the cost and time data collected from period to period as the project progresses, some very useful graphic reports are produced that help the managers to answer such questions as :

  • Is the project on schedule?

  • How far over budget are the present costs?

  • What are the sources of delay and overruns?

Accounting Problems with PERT/Cost

The managerial benefits from the PERT/Cost system derive largely from the increased detail with which the costs are categorized and reported. Although this detail permits closer control of project performance and costs, it is also the cause of some accounting problems. More specific of them include the following:
· Indirect Costs: Some project costs are not easily identifiable with end items or specific work packages. Conventionally, such items are considered to be a part of the overhead.
· Overhead Control: Since overhead is a sizable expense, and since overruns may result from indirect as well as direct costs, it seems desirable to provide some means of exerting better control over overhead.
· Material Costs: Because of long lead time between release of material requirements and their eventual use, actual costs of materials are often incurred long before the work packages are scheduled to begin.

Time Calculation for Project Activities

Expected Times for Activities
For each activity in the project network, not only is an estimate made of the most probable time required to complete the activity, but some measure of uncertainty is also noted in the estimate. The pessimistic estimate and optimistic estimate is also made to have an idea of the approximate maximum and minimum completion times respectively for the activity.

PERT calculates the expected value of activity duration (te) as a weighted average of the three time estimates. The expected time is the best estimate that we can make of the time required for a single occurrence of an activity.

Variability of Activity Times
One measure of variability of possible activity times is given by the standard deviation of their probability distribution. Standard deviation and variance are commonly used as measures of variability among numbers. The variance (Vt) is simply the average squared difference of all the numbers from the mean value. The standard deviation (St) is the square root of the variance.

The Expected Length of a Critical Path
The expected length of a sequence of independent activities is simply the sum of their separate expected lengths. We calculate a te for every activity in the project network and use these te s to identify the critical path. We obtain an expected length of the project (Te) by summing the expected activity durations along the critical path.
Similarly, the variance (VT) of a sum of independent activities is equal to the sum of their individual variances and the standard deviation of the project length (ST) is the square root of VT.

Effects of Near-Critical Path
We calculate Te by adding the te s of the critical path activities. But it might not always be the best estimate of project length because under some combination of activity times and variances, a near-critical path may exist with a higher variance than the "main" critical path. Thus, where the possibility of uncertain activity times is admitted, the possibility of alternate critical paths is implied and the simple estimating procedures tend to yield overly optimistic results.

Gantt charts

A Gantt chart is a matrix which lists on the vertical axis all the tasks to be performed. Each row contains a single task identification which usually consists of a number and name. The horizontal axis is headed by columns indicating estimated task duration, skill level needed to perform the task, and the name of the person assigned to the task, followed by one column for each period in the project's duration. Each period may be expressed in hours, days, weeks, months, and other time units. In some cases it may be necessary to label the period columns as period 1, period 2, and so on.

The graphics portion of the Gantt chart consists of a horizontal bar for each task connecting the period start and period ending columns. A set of markers is usually used to indicate estimated and actual start and end. Each bar on a separate line, and the name of each person assigned to the task is on a separate line. In many cases when this type of project plan is used, a blank row is left between tasks. When the project is under way, this row is used to indicate progress, indicated by a second bar which starts in the period column when the task is actually started and continues until the task is actually completed. Comparison between estimated start and end and actual start and end should indicate project status on a task-by-task basis.

Variants of this method include a lower chart which shows personnel allocations on a person-by-person basis. For this section the vertical axis contains the number of people assigned to the project, and the columns indicating task duration are left blank, as is the column indicating person assigned. The graphics consists of the same bar notation as in the upper chart indicates that the person is working on a task. The value of this lower chart is evident when it shows slack time for the project personnel, that is, times when they are not actually working on any project.

PERT and CPM

PERT chart
A PERT chart is a project management tool used to schedule, organize, and coordinate tasks within a project. PERT stands for Program Evaluation Review Technique, a methodology developed by the U.S. Navy in the 1950s to manage the Polaris submarine missile program. A similar methodology, the Critical Path Method (CPM), which was developed for project management in the private sector at about the same time, has become synonymous with PERT, so that the technique is known by any variation on the names: PERT, CPM, or PERT/CPM.
A PERT chart presents a graphic illustration of a project as a network diagram consisting of numbered nodes (either circles or rectangles) representing events, or milestones in the project linked by labeled vectors (directional lines) representing tasks in the project. The direction of the arrows on the lines indicates the sequence of tasks. In Figure 3.1 the tasks between nodes 1, 2, 4, 8, and 10 must be completed in sequence. These are called dependent or serial tasks. The tasks between nodes 1 and 2 and nodes 1 and 3 are not dependent on the completion of one to start the other and can be undertaken simultaneously. These tasks are called parallel or concurrent tasks. Tasks that must be completed in sequence but that don't require resources or completion time are considered to have event dependency. These are represented by dotted lines with arrows and are called dummy activities. For example, the dashed arrow linking nodes 6 and 9 indicates that the system files must be converted before the user test can take place, but that the resources and time required to prepare for the user test (writing the user manual and user training) are on another path. Numbers on the opposite sides of the vectors indicate the time allotted for the task.

The PERT chart is sometimes preferred over the Gantt chart, another popular project management charting method, because it clearly illustrates task dependencies. On the other hand, the PERT chart can be much more difficult to interpret, especially on complex projects. Frequently, project managers use both techniques.

Critical Path Method (CPM)
Critical Path Method (CPM) charts are similar to PERT charts and are sometimes known as PERT/CPM. In a CPM chart, the critical path is indicated. A critical path consists of that set of dependent tasks (each dependent on the preceding one) which together take the longest time to complete. Although it is not normally done, a CPM chart can define multiple, equally critical paths. Tasks which fall on the critical path should be noted in some way, so that they may be given special attention. One way is to draw critical path tasks with a double line instead of a single line.

Tasks which fall on the critical path should receive special attention by both the project manager and the personnel assigned to them. The critical path for any given method may shift as the project progresses; this can happen when tasks are completed either behind or ahead of schedule, causing other tasks which may still be on schedule to fall on the new critical path.
Simulation of a Network
The normal PERT procedure which bases the estimates of Te and ST on a single critical path can grossly overstate the probabilities of completing a project by a given date, especially if there are one or more parallel paths through the network which are nearly critical, and/or which have relatively large variances. By use of Monte Carlo sampling technique, activity times are randomly selected for each activity from some appropriate frequency distribution. The project length and critical path data are then calculated in the normal way, based on these times. This procedure is repeated several thousand times and finally an average project length and standard deviation are calculated on the basis of simulated data. In the simulation procedure no single path is identified as the critical, but the probability of each activity's being on a critical path is estimated. Thus, this procedure helps the planner in identifying the critical activities which may not lie on the same path.

Scheduling Computation , Critical Path Method. (CPM)

The basic scheduling computation consists of three distinct sequences:
i. The forward pass through the network,
ii. The backward pass through the network,
iii. Calculation of slack or float and determination of critical path.

Forward Pass Computation
The forward pass through the network is made by computing the earliest expected occurrence dates for every other event and the earliest completion dates for the activities. In case there is more than one activity merging at a point, the maximum of the completion times is taken as the earliest completion time. Starts should be chosen as it fulfills the condition that no activity can begin until all its constraining activities are complete. The forward pass procedure proceeds event to event along each node of the network until the end event has been reached. The expected duration time will be longest sequence of activities through the network i.e. the earliest completion time of the last event.

Backward Pass Computation
The planner establishes the latest allowable occurrence date for each event (TL) and latest allowable start at completion date for the event. In the backward pass the planner employs the path tracing procedure characteristic of the forward path in reverse starting with the last event and proceeding backwards along each path to the baseline or the beginning event.

In the backward pass a latest allowable occurrence time is set for the end event corresponding to the scheduled or expected completion date for the project. In the absence of a scheduled end later the earliest expected completion date is automatically set as the latest allowable date.

Slack Computation
Slack is defined as the difference between an earliest possible occurrence time for an event and its latest allowable occurrence time. This difference expressed in time units indicates how the occurrence of the event can be delayed without delaying the end event in the network.

Identification of Critical Path
Once we have determined the slack values attached to various events and activities in the network, the critical path is identified. Critical path can be defined as the longest sequence of activities leading to the end objective. It is the path with the lowest slack value. When a network contains negative slack, the path with the most negative slack is identified as the critical path.

There are many types of slack defined in literature but the two most important ones are Total Slack and Free Slack.
Total Slack: It is the amount of time an activity could be delayed without affecting the overall project duration.
Free Slack: It is the amount of time an activity could be delayed without delaying subsequent activities. It is equal to the difference between the earliest start time of the successor activity and the early finish time of the activity in question.

The Problem of Uncertainty
The project network is the basis of both the PERT and the CPM technique. The notions of the critical path and activity slack are common to each. But these models were developed independently and in somewhat distinct problem settings.

PERT was developed for and has been used most frequently research and development types of programmes. The technologies are rapidly changing and their products are nonstandard. CPM on the other hand, has most frequently been applied to construction projects. The activities in these projects use standard materials whose properties are well known. They employ long-developed and well-seasoned components, and they are based on a more or less stable technology. The PERT technique assumes that the activities and their network relationships have been well defined, but it allows for uncertainties in the activity times.

Constructing the Project Network

The first step is to determine the end objective. Next, the major areas of endeavor that will contribute to the accomplishment of the plan must be determined.
The major activities that lead to the end activity are then identified and listed. After this the following procedure is adopted.

  • Write the description of the end objective near the right margin of a large piece of paper, centered vertically.
  • Determine which major activities must be completed just prior to the completion of the objective, and write them to the left of the last activity.
  • Indicate, by drawing a line, the work to be done between the events.
  • Determine which activities must be completed prior to the accomplishment of each of the activities listed and record them and their associated activities, another step to the left.
  • Report the process till the first activity is reached. Layout the network so that all activity lines flow from left to right. They may cross one another as long as they can be followed easily.
  • When the network has been laid out, assign even number starting with the beginning event in the order in which they must be completed.

Rules for Network Development

  • No event can occur until all the activities leading into that event have been completed.
  • An activity succeeding an event cannot be started until that event has occurred.
  • There should not be any close loop in the network, that is, an event cannot occur more than once.
  • Activity lines cannot be drawn from the middle of other activity. If it is necessary to start an activity from the middle, one must define the exact point at which the second activity starts. An event is placed at this point, and this event may initiate the desired activity.
  • All activity heads should be marked with an arrow to indicate the direction of flow.
  • All events should be numbered and so this number should be unique, as to give an activity reference.
  • All activities should have unique reference number, i.e. between two events there should be only one activity.
  • In a network, flows are from left to right, that is , activity lines with arrow heads that point to the left should be avoided.
  • There should be only one initiating event and one objective event, thus every activity on the networks should be completed to reach the end objective work. Hanging activities are not permissible.

Dummy Activities

Dummy activities are activities which consume no resource or time. They are used:
i. To maintain the logic in the network diagram.
ii. To show interdependencies between events, and
iii. To give a unique number or activity reference to an activity.
Dummies are also often used to tie the completion of several activities to the beginning of a single activity or vice versa.

Topological Ordering

The activities of the project are ordered in such a manner that no activity appears in the list before all its predecessor activities have been considered. Hence activities are ordered according to the lower preceding node number first.

Network Definitions

Before studying the development of network, it is essential to have an idea about the basic concepts and terms involved in the technique as explained below:
Project: It is a task with defined objective.
Network: A network is a graphic representation of all activities and events that must be completed to reach the end objective of a project, showing the planned sequence of their accomplishments, their precedence relationships and interdependencies. Thus the basic components of a network are events and activities.
Event: An event is a specific accomplishment, physical or mental, in a project. The main characteristics of an event are.
It is recognizable at a particular instant of time, which is a point in time and not a passage of time.
It does not, therefore, consume time or resources.
It is represented on a network by a geometrical figure such as a circle.
It expresses a state of being, such as: contract awarded, project approved, plant commissioned etc.
Activity: An activity represents a job or a project element to be completed. It is a relationship between two events and usually devotes the efforts required to perform a task measured in terms of elapsed time. The characteristics of an activity are:
It usually consumes time and resources.
It is represented on the network by an arrow, the direction of arrow indicating the sequence in which the events are to occur.
It must be independent i.e. each arrow is used to represent exactly one, and only one, operation of segment of an overall programme.
It indicates works, such as: preparation of decision, scrutiny of tenders, etc.
Predecessor Event: An event which restricts or precedes another. It establishes the starting point of an activity.
Successor Event: An event which succeeds another. It establishes the termination point of an activity.
Objective Event: An event which has no successor event. It is the goal of the project and usually has a committed date.
Activity Duration: The time required to perform an activity on a network is termed as activity duration. It is the time estimated for performing that activity. It is desirable that the time estimates of an activity should be :
1. made by personnel most familiar with the individual activities and responsible for their accomplishments
2. based on normally available and expected resources, and
3. expressed in suitable times such as days/weeks.

Life Cycle of Project

The project planning process consists of the following:

i. Setting the project start date.

ii. Setting the project completion date.

iii. Selecting the project methodology or project life cycle to be used.

iv. Determining the scope of the project in terms of the phases of the selected project methodology or project life cycle.

v. Identifying or selecting the project review methods to be used.

vi. Identifying any predetermined interim milestone or other critical dates which must be met.

vii. Listing tasks, by project phase, in the order in which they might be accomplished.

viii. Estimating the personnel necessary to accomplish each task.

ix. Estimating the personnel available to accomplish each task.

x. Determining skill level necessary to perform each task.

xi. Determining task dependencies

1. Which tasks can be done in parallel?

2.Which tasks require the completion of other tasks before they can start?

xii.Project control or review points.

xiii.Performing project cost estimation and cost-benefit analysis.

What is Project Management ?

A project is a set of tasks, arranged in a defined sequence or relationship, that produce a pre-defined output or effect. A project always has a start, middle and an end. When "projects" are big, important and costly, limited time and resources are available to accomplish goals. Sometimes the projects are risky. This is where Project Management comes in. Project Management can help guide efforts and provide effective outcomes. Project Management tools and techniques, enable to function with speed, affordability and complexity.

Project Management is a set of principles, methods, tools and techniques for planning, organizing, staffing, directing and controlling of related activities to achieve an objective with time, cost and performance constraints.

Project Management function primarily involves Planning, Monitoring and Controlling. These involve estimating, scheduling, tracking progress and implementing corrective action wherever needed. Effective project management reduces the risk of failure and increases the probability of success. An efficient Project Management software provides the Project Managers, the ability of interfacing with management and giving them a proper appreciation of the state of the project and ensuring that they can make appropriate resource allocation decisions that involve time, people and money.

Hence as learners of Industrial and Production and Mechanical Engineering we find it challenging and interesting field to work in and contribute.

There are no hard and fast rules or techniques evolved that can be used to tackle all the problems in this area. Different organizations may have conflictive objectives therefore unique solutions are required for each individual organization. It is also a dynamic system involving uncertainties and inter-dependencies of time and cost parameters for various activities in a Project, making it difficult to determine the most effective strategy.

What is Industrial Engineering ?

This is branch of engineering that deals with the creation and management of systems that integrate people and materials and energy in productive ways.

This is Management related to industry.Where we manage our resources like human resource , material , machine , finance , energy in eficent way to increase production while reducing the cost of manufacturing.